Get better at troubleshooting and debugging software
Errors, by their nature, are basically reproducible and expository yet vaguely indicative (I do blame translator writers for this in part— As the error messages lack enough details at the compiler/interpreter level) of the cause and sometimes seemingly conflicting and/or mutant (meaning they can change in form and expression). Errors (and Bugs) are always the eventuality of a flaw in the source or animated form of a computer program. They can also be deconstructed and analysed for information that is critical to gaining insight as to where and why they occurred. This is the same regardless of the programming language being considered.
I am one person who doesn’t believe that code can have a “mind of its own” like some colleagues have claimed (😂 — had to laugh sorry) except in the context of deep learning, I guess.
I usually hear colleagues say things like “hope-driven development” or “I speak in tongues in the face of software bugs” to suggest that most code breakages or code defects can pop up without any real underlying issue or can be an attack from the “devil” on their codebase (😭 — I certainly hope not). Usually, i enjoy these comments from practitioners as banter and i laugh out loud (😆 — Cos why not ?). I do honestly hope that most software developers don’t actually believe that an error can occur in code without a fundamental reason.
Sometimes, software engineers get “lucky” as they throw in some haphazard measure of what hardly would pass for proper troubleshooting (or debugging) and suddenly a nagging error disappears — just like that! At such times, the software engineer pats himself on the back (maybe) but cannot remember what steps were taken to clear the error and cannot provide context as to where and what triggered the error.
This is a real problem! The eventuality of such a shoddy way of debugging is that the supposedly “squashed error” rears its ugly head in the future and becomes more often than not 10x worse.
The obvious commonality in these scenarios is a lack of knowledge in the systematic process that is found in proper troubleshooting (debugging). There are several methods that software engineers employ to fix bugs, some are good and some are terrible. However, in this article, I am going to share with you what I will regard as the best practice for effective debugging.
However, if you do get a handle on this method which i am about to share with you, it can prove a vital addition to your toolbox of skills as a software engineer going forward.
So, how do we get real value for the time and effort we spend debugging as software engineers (which in some cases can be more than the actual software development time) ? How can we know for sure that an error (maybe bug) is truly and completely dealt with and didn’t just mutate ? How do we determine by a process of elimination what areas of a codebase to look into with respect to an error ? All these questions will be answered as we go along.
In this article, i am going establish the difference between an error and a bug. This article will be both exploratory and instructive. Secondly, we will discuss what the many causes of errors in a codebase are and then what tips you can apply to getting better at debugging code and how to know if an error is truly gone or has just changed form. Finally, we will look at how to work backwards from error messages that are either misleading and/or do not provide enough information for what went wrong. I will also be using JavaScript/Typescript, Java and Python and Haskell as case studies in this article.
Before you read this article: you need to read and/or understand the following terms: code path, garbage collection, thread safety, tracing, side effect, call stack, assertion and invariant.
The Origins of Errors
Let’s start by differentiating an Error from a Bug — yes, they are different — and why they occur.
Errors are caused by failures (or defects) in the execution of code logic where the software, at runtime, is put into an incorrect and/or irreconcilable state due to a coding mistake (errors of omission and/or commission). These are mostly caused by breaking the rules of a coding language.
Bugs on the other hand are faults in the logic (either executed serially or in parallel — think “concurrency”) of the software that is then reflected in the incorrect (or sometimes unpredictable) output/behavior for specific inputs under specific conditions. In other words, Bugs cause software to give out unintended and unanticipated output (an error may or may not accompany a bug) and errors are caused by incorrect runtime state.
It’s a no-brainer, unsafe typed logic is one of the leading causes of errors (not bugs). Similarly, bugs are mostly caused by the limitations of shared-state concurrency. To deal with this limitation, message-passing concurrency was invented as a better alternative to overcome the problem of shared mutability or shared mutable state ensuring thread-safe operations in any piece of software built with these more mature programming languages (e.g Scala).
Also, errors could be caused by the incorrect handling/procuring of resources like heap memory allocations e.g, the Java Virtual Machine cannot fulfill a memory request on the OS) and/or I/O handling for example, using file descriptors , you’ll notice that your (NodeJS) app will return an error if you forget to close the I/O stream.
More so, shared mutability throws up problems common in programming languages like JavaScript, Java & Python. However, languages like Go, Scala , on the other hand, fix these issues by relying on message-passing concurrency (actors).
For any good and experienced troubleshooter, the process of troubleshooting doesn’t start after the code is written, it starts while you write the code.
The Art of Debugging — Open Sesame! 🌀
Now that we know where errors come from and how to avoid them where possible, let’s find out how to deal with them as they arise in a defective codebase. Here are simple tips to guide you through (apply them in the order I have depicted here):
I like to call these the AATPIEGOWS (pronounced: aht-pai-go-wus) formula. This formula makes up all the tips i personally have used for years in setting up error handling and debugging code and most times, quickly too.
Analyse the call stack (stack trace) and error message. Error messages can be scary and intimidating sometimes. Especially for new developers. However, this is a crucial part of debugging code of any kind or size. One item that is closely associated with error messages whenever they show up is something called: the call stack.
A call stack is a stack data structure (organized in random-access memory) that allows the execution of functions/methods and the variables they can access (local or global scope) to be tracked in way that provided a history of what called what and whether a function/method is done running.
Every program has one entry point (or main/index) where the program begins and one or more exit points where it ends. This is the very composition and makeup of software anywhere in the world.
It is because of the way we organise our program code into a series of function/subroutine (functional) or class method calls (OOP) which call one another in turn that gives rise to the need for a call stack as part of the computer memory. Now, you can’t access the call stack directly. However, you can access a serialized version of it indirectly from the error object. Here is how you can do that in:
- JavaScript: error.stack;
- Python: traceback.print_exc();
- Java: exception.printStackTrace();
- Haskell: error “message”;
The stack trace contains the following information:
- file name where the error occurred
- line number in the file where the error occurred
- the column number in the file where the error occurred (omitted in Python)
- function/class method name in which error occurred
Each entry in the call stack (now accessed in its serialized form as the stack trace) is called a stack frame and contains all the information listed above. The only part of the stack trace you should be interested in is the top of the stack. It’s there that the problem exists or begins.
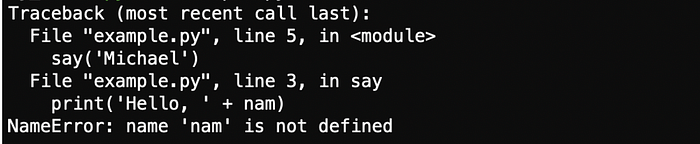
Below, we see an example of a stack trace in Python, JavaScript (NodeJS) and Haskell. For Python, at the top of the stack, `example.py` is the file name where the error occurred, 3 is the line number in the file `example.py`, no column number, and print is the name of the function on which the error occurred.
It is important to understand that in Python, the top of the stack is at the bottom of the traceback as you can see in the stack trace just below (most recent call last).
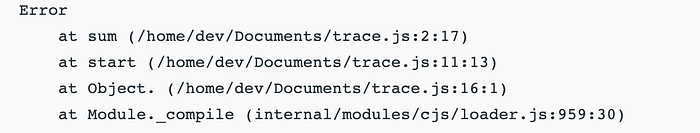
For JavaScript, at the top of the stack, `trace.js` is the file name where the error occurred, 2 is the line number in the file `trace.js`, 17 is the column number on that line, and sum is the name of the function in which the error occurred.
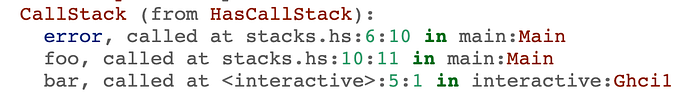
For Haskell, at the top of the stack, `stacks.hs` is the file name where the error occurred, 5 is the line number in the file `stacks.hs`, 1 is the column number on that line, and error is the name of the function in which the error occurred.
Whew! So, with that out of the way, let’s talk about error messages. Error messages give us the description of the error in question usually prefixed by the name of the error. This helps us further to know what went wrong.
For instance, the IndexError in Python is similar to an ArrayIndexOutOfBoundsException in Java. A NameError in Python is similar to a ReferenceError in JavaScript. A TypeError in JavaScript is similar to an AttributeError in Python. A RangeError in JavaScript is similar to a MemoryError in Python. An AssertionError in JavaScript is the same as an AssertionError in Python. So, you see that different programming languages usually converge in the semantics because errors are all the same at a lower level on the computer.
All you have to do is look at the file (using the file name), line number at the top of the stack trace and read the error message and name to begin to figure out what is wrong.
Always handle errors close to the entry point of a software program (bottom of the call stack). There is a reason why you don’t get to fix errors easily even when you analyse a stack trace properly especially for errors that emanate deep in the call stack. The reason is you are setting up try/catch blocks deep in the call stack and trying to handle errors that should be handled closer to the entry point (or bottom of the call stack). The reason why you should handle errors closer to the entry point of a software program is so that the final error message at the point of a runtime crash tells you exactly where the problem is without you having to dig through the stack trace. There are 2 ways to ensure this in languages like Java.
- Using the throws statement
- Catching the error and re-throwing the same error.
In any other programming language, you have only one way — catching and re-throwing the error. This is why i love the throws statement in Java so much. I believe it is one of the best parts of Java. In Java, the throws statement allows you to delay handling the error (especially inside a method or function deep in the call stack) while adding context using a hint that there’s a need to handle a very likely-to-be-thrown error and makes it easy to handle it closer to the entry point (the main method) so that the actual error that caused the failure or crash is revealed easily.
Without setting things up like this, you would always have to analyse the stack trace to figure out where and what went wrong. However, sometimes, we need to throw new errors (instead of re-throwing the same error) with a more domain-specific message at different levels in the call chain. The problem with throwing errors like this is that context is lost as the error travels from call frame to call frame. So, you have to add context about what caused the error you are reporting about. More so, when using the throws statement, you don’t need to jump any of these hoops. JavaScript now has a neat little trick feature that seems to mimic the function of a throws statement but by adding context by forming a chain of errors linked by a cause.
Trace and track all code paths at runtime. There is a need to keep an audit trail of the execution of the code when writing it up. It’s a lot like tracing in distributed software.
You can utilise trace statements (e.g. `console.trace()` , `console.debug()` and `console.assert()` for JavaScript, assert for Python and for Java) on relational, arithmetic, bitwise statements and/or log primitive or reference values to standard output.
These steps are very important for keeping an eye on the flow of control of the code as it is executed and the changes in program state associated with every statement executed; be it a looping or branching statement. This can be tedious but the overall benefit is very rewarding.
This is where assertions and traces (execution traces) are used in embedded systems software) come in. They are able to tell you why a code path was taken during code execution and which code paths were taken depending on the inputs to the software (monolithic or distributed). Assertions are the building block of invariants.
On the other hand, Traces (specifically execution traces) are the building blocks of telemetry (tools like OpenTelemetry help with this). Truly understanding how overlapping logic drives code execution is an underrated skill but a very vital one.
Invariants are also very important in debugging as they can point you to why a given section of your code works or why it doesn’t work. It helps build confidence in the soundness of your code logic similar to the way unit tests do.
An Invariant is a relational condition and/or expression which evaluates to a boolean and MUST hold true for the duration of code execution for a given section of the codebase. When an Invariant becomes false during code execution, it means there's a problem in the logic currently executing.
When an invariant fails, it means something is wrong with a prior code path. In both OOP languages like Java and Python or imperative languages like JavaScript, its possible to build class invariants that help you check your code logic.
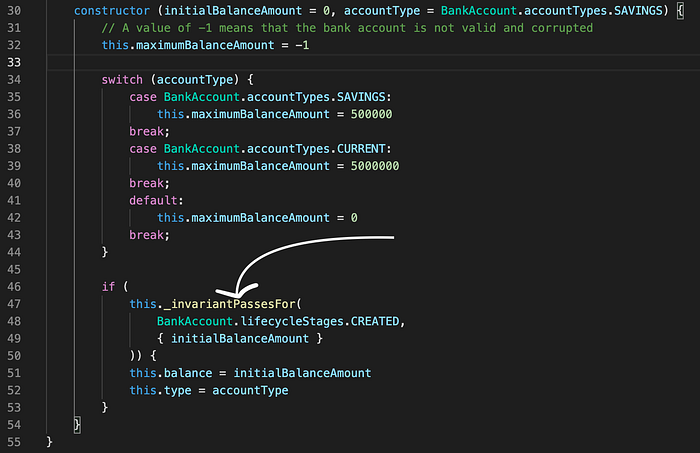
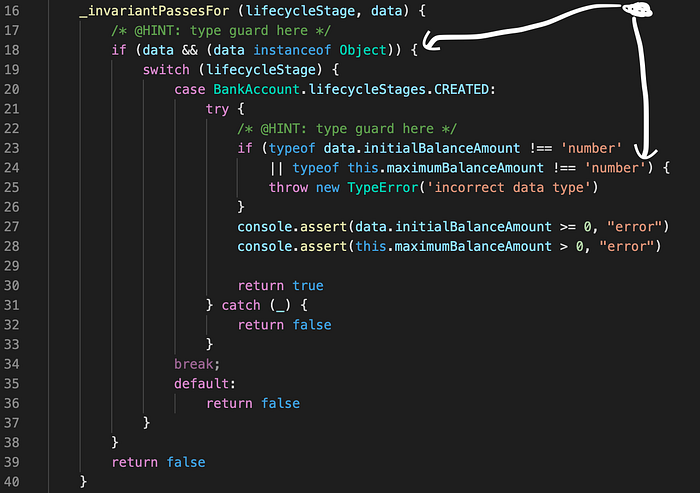
Below is an example of a BankAccount class written in JavaScript (ES6) with a class invariant defined in a method (_invariantPassesFor) using an assertion statement (using console.assert — It’s a pity that TypeScript assertion signatures doesn’t recognise console.assert statements so you can use throw statements instead). This class invariant works by checking an argument to the constructor of the BankAccount class and also a property that should be zero when a bank account is CREATED.

So, you can see above that the invariant used depends on the stage at which the instance of the class is at any moment (CREATED, DESTROYED).
The CREATED lifecycle stage of a class instance maps to a constructor call while the DESTROYED lifecycle stage of a class instance maps to a garbage collection event on heap memory.
Interestingly, the DESTROYED lifecycle stage doesn’t apply to JavaScript but apply to certain other languages. In such languages (e.g. Python, PHP and C++), you can detect when an instance of a class is garbage collected (a.k.a destroyed) by defining a class method called a destructor (complimentary to a constructor).
Execution traces on the other hand involves a specialised use of logging to record information about a program’s execution while watching individual events and/or variables (state changes) in the process. For JavaScript in both browsers and NodeJS, there are functions that can help you watch/monitor variables during code execution as well as trace code paths. These include the following:
- console.trace (browser and NodeJS)
- console.count (browser and NodeJS)
- console.debug (browser and NodeJS)
- console.time (browser and NodeJS)
- watch (the equivalent of monitor on the browser — only NodeJS)
- unwatch (the equivalent of unmonitor on the browser — only NodeJS)
The functions above are very crucial to debugging on the command line in NodeJS.
Talking about browsers, there are certain debug helpers (browser APIs) that are supported in most browsers currently (except Firefox). These are very powerful functions that are defined on the window object and can only be used inside the console namely:
- monitor: helps to monitor variables during code execution
- unmonitor: reverses the effect of monitor
- monitorEvents: helps to monitor browser events like “click” on the DOM
- unmonitorEvents: reverses the effect of monitorEvents
- debug: helps to track when a named function is called during code execution
- undebug: reverses the effect of debug
These functions above additionally help you with Tracing on the browser. Tracing in this way helps you see in a very detailed manner how your code is getting executed. Take a look at the console screenshot below, it shows examples of how to uses the helpers within the browser console.

In the same vein, you can also setup server-side execution traces in NodeJS. See the example in the screenshot below:
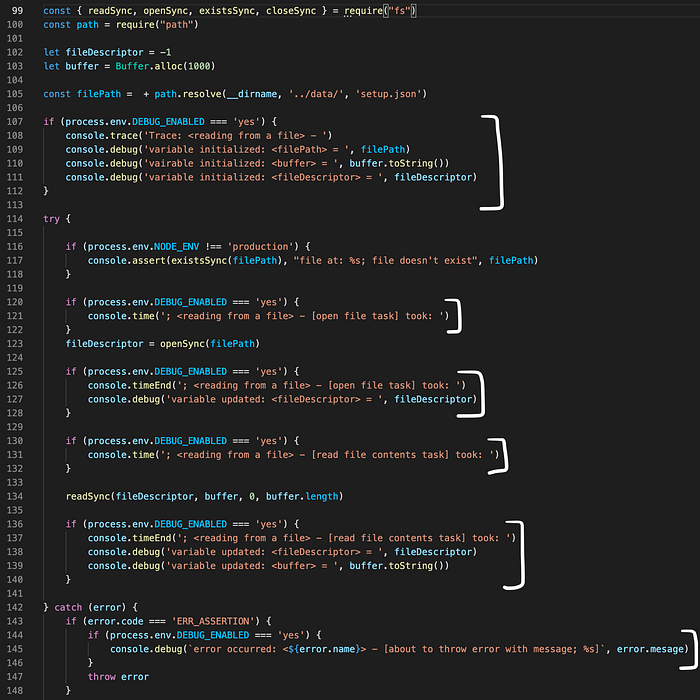
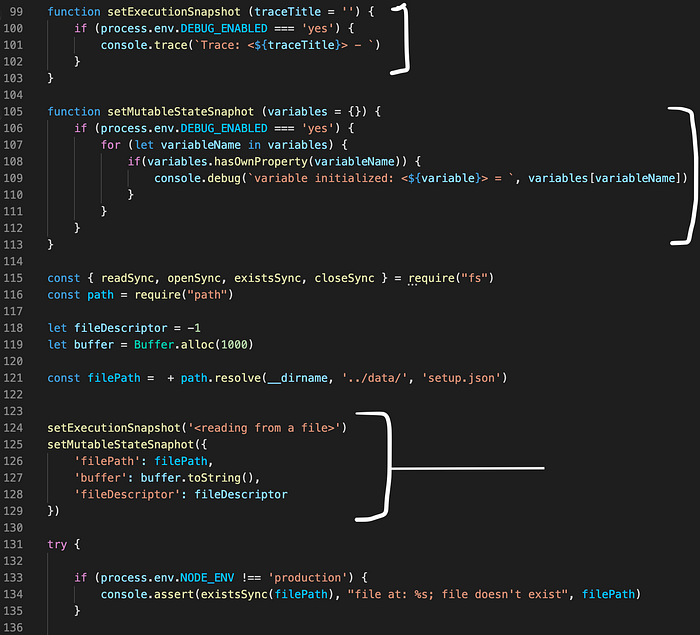
As we can see above, this isn’t the cleanest way to set it up but we can abstract away all console statements that provide execution traces into reusable functions. See below:
Execution tracing can make all the difference between a guessing while you debug code and actually debugging the code quickly.
Proceed with a checklist of possible problems. There is no short supply of the issues that may arise in the course of building software. It is then imperative to have a checklist that can be ticked off after each heuristic is applied. The quality of this checklist grows with your experience level in troubleshooting. You might want to begin with questions like:
- What is the memory limit of the running process/thread for this code ?
- Is the error experienced by all users in any location or a particular user ?
- Does it happen on select platforms or on all platforms ?
- Am i asynchronously updating shared mutable state in a way that forces an invalid code path to be followed ?
- Am I dealing with a programming language quirk (looking at you JavaScript — 😏😠)
- Is a function getting called more than once that should be called only once ?
- Is a particular valid code path being handled properly ?
- Is the program hitting one or more invalid code path(s) ?
- Has the limit of open connections to the database been reached — connection timeouts ?
- Is there a side effect from a function call that is interfering with mutable state and then blocks further execution of the current code path ?
- Are Java static class fields getting garbage collected properly at the end of program execution ?
- Is this Haskell monad resolving a side effect properly ?
- Is there a race condition somewhere in the business logic ?
- Is there a typo in my REST/GraphQL API call setup or my RPC call site ?
- Did you mistakenly mutate a function/method argument that was passed by reference that you didn’t intend to ?
- Did you make a change to code logic in one section of the codebase that could have affected another section of the codebase (second-order thinking helps here) ?
Keeping track of everything in your head can be very hard. The cognitive load alone is crazy and the human brain can only take so much at a time. A written checklist that contains a list of hypothetical yet plausible cause(s) for the error you are experiencing and trying to debug comes in handy. You can then go ahead to check each off as you investigate and find each item to be false.
Improve your codes’ readability. You can’t go wrong when you write idiomatic code. Code that is clear and easy to understand by you (first of all) and by others can never go out of style — your future self and other developers will thank you. Sometimes, you might not get to work on a codebase for a long while but you should be able to come back and pick it up.
Making code very readable takes effort and intentionality and it helps with debugging more than you could ever think. Unreadable code makes debugging a chore (if not a nightmare).
It’s important to use meaningful variable names and limit the nesting of selection and/or loop statements (e.g. if, switch, while). Highly readable code will definitely improve an engineer’s debugging experience.
This also involves adding more context to your error messages. This improves readability and helps with debugging later on.
Employ breakpoints more than log statements. The truth is, logging will not go out of fashion especially when debugging — it’s convenient. You could easily throw in a `console.log`, right? — but it has its limits (such as execution coverage — If the programs’ execution never gets to a particular point where the log statements are present then it doesn’t work) and it can be bad for DX (developer experience) and overall productivity.
You can setup logging by instrumenting the codebase so it can log critical runtime info to standard output a.k.a the terminal. However, a better option will be to utilise breakpoints. It’s important to be methodical about this and not do it haphazardly.
There has to be a big picture reason as to why and where you place a breakpoint (not just on statements inside branch/loop statements) or console debug or log statement(s) within the code. This will ultimately guide you to exposing how your code behaves at runtime.
One of the best features of breakpoints is that you can pause and resume code execution as you inspect memory usage or the value of different variables. Breakpoints also follow code execution irrespective of the file where the calling or called code is located. Finally, it is important to note that console logs can be misleading some times.
Go back to where it last worked and find the difference. Discovering the disparity between then and now can get you very far along quickly. If it was working before and no longer working now after the change, then it might be safer to roll it back to when it worked. version control systems like Git make this easy and possible. You can always work your way back once you figure out the difference and narrow down to find out exactly where the defective logic is located in the codebase. You could leverage Git Blame to enable you to figure out exactly where the faulty code was introduced.
Write defensive/offensive code. It is important to know the consequence of every code statement in any given section of your codebase. You need to know the return type(s) and parameter type(s) of functions when called, you need to know what side effects are initiated by any function/method call. Also, you need to handle all possible errors that may occur in all valid code paths properly.
Usually, when errors occur in valid code paths and aren’t handled properly, the whole software runtime crashes but you get no meaningful error message. All you get is a cryptic runtime error that your code has crashed. This can all be avoided by writing defensive code.
There are several tools to help you write defensive code. In JavaScript (Typescript), type guards can be used to further defend your code against the quirks of JavaScript and/or any incorrect variable data type(s). Similarly, type guards also exist in Python v3 to achieve the same thing.
Earlier in this article, i shared a code screenshot of the BankAccount class, which had a class invariant method (_invariantPassesFor) defined on it. The invariant works (a.k.a stays true) when data with the correct type is passed but what if data with the incorrect type gets passed in ? Most definitely. Why, you asked ? Take a look at the code below:
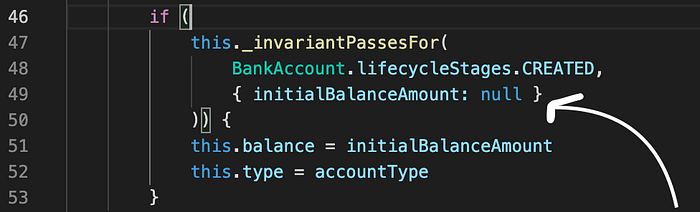
When null gets passed into the class method (_invariantPassesFor), it gets compared (≥) with zero (0). This relational check passes and the invariant stays true but the value is invalid because initialBalanceAmount for a BankAccount cannot be null.
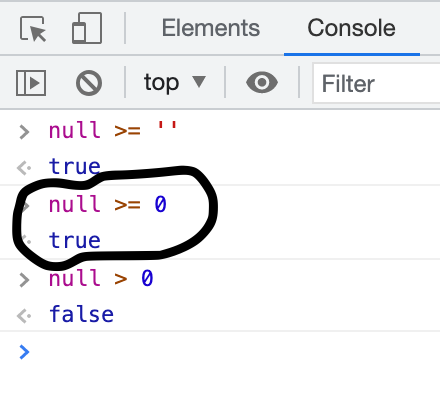
So, how do we fix this ? We fix it by introducing a type guard!
Furthermore, it is equally important to make use of try-catch statements where possible and necessary. This is another important way of writing defensive code. Always wrap your code in a try/catch/finally blocks and handle the error or propagate it by re-throwing the error to the upper portion of the call stack. Errors that occur nested deep within the call stack are very unhelpful and confusing.
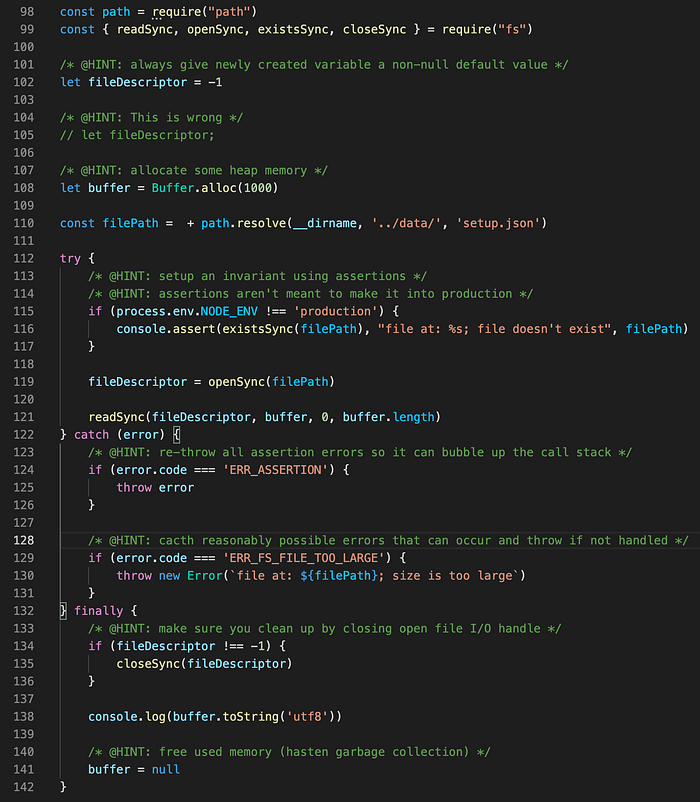
Do not create a variable and leave it undefined or null. Most importantly, do not let optionality or possibly undefined or null values propagate and data flows through the logic of software. Nullable/undefined booleans ? default to false! Nullable/undefined arrays/lists ? default to an empty array or list! Find and assign sane defaults to reduce the need for branching statements as you work with state/data in your code to avoid needless complexity. Always give newly created variables a default non-null value (setting newly created variables to null or undefined values are a source of easily avoidable errors I have seen). Only use null to hasten garbage collection (i.e. to free used memory) or report to a calling function/method that a given task was inconclusive or impossible.
If the given task is invalid or out-of-scope, throw an error instead. Lastly, scope your variables properly as this can bite you in the ass more times than none (trust me I have seen it happen over and over).
Stack Overflow can help too. Stack overflow is super helpful when all the above tips don’t seem to be working. The outcomes of the network effects from sharing a problem or code challenge can save time and help you immensely. This should be a last resort after you have tried everything. Search for topics similar to the error you are trying to fix. Narrow down to the one with the highest votes and extract a solution.
Divide & Conquer 🗡
As i have often said, learning to debug software is one of the most important technical skills you would ever possess. To carry out effective debugging on a codebase, it is vital as you go along to work with heuristics (intelligent guesses — which can mostly be built over years of experience) but more importantly is to quickly and systematically narrow down the search area for debugging. Whenever you encounter an error, you cannot afford to search the whole codebase for what you think might be the cause.
It is safer to isolate and test each part of the code that makes up the entire software in an idempotent manner (you can do this more effectively by running automated unit tests). Utilise tests (unit and integration) as a way to reproduce and intentionally force errors and collect feedback. Also, improve the quality of your tests by creating test cases with a wide range of correct and incorrect inputs.
Conclusion
When debugging software, it pays to be proactive than reactive. Taking into consideration that the way you write your code ultimately affects the bug density levels in the code and also affects the ease at which you go about fixing errors that slip through.
Also, the flaws or inadequacies of the programming language can play a role in how much effort you have to employ to keep bugs out. Haskell for example has a lovely type system that JavaScript wishes it had and this means that JavaScript (and TypeScript) code has to be more defensive (or offensive) about types than in Haskell.
Similarly, constant arguments in C++ helps prevent bugs and minimise the need for defensive copying which for some Java code is mostly maximised to avoid bugs.
These differences don’t mean that bug-free (or error-free) code can’t be wrriten in each of these programming languages, it simply means that the programmer has to be well aware of the limits of the capability of each programming language. It doesn’t have to be a nightmare to debug code. It could be easy if you are disciplined enough to stick to these preventive as well as curative measures.
